TheoLt Release 10 is GO!

Watch this space for full details of the updates, the improvements and how-to’s !

Existing users should contact us now for update details.

TheoLt, TheoLt Contour and TheoLt Tools now improve the productivity of BricsCAD to V17 and AutoCAD to Release 2017 for anyone using Total Station, Laser Distance Meters or Laser Scan Data for the productions of plans or elevations.

TheoContour R10 is coming

No, we do not post often enough here.
No, we do not update our site enough.
Yes we need to work on this.
However you can be sure when we do post, it is important, it is interesting and it is new!

In this case what is new is TheoContour R10!

Its just a week or two away – we are just finishing off the installer and testing the installer.

What can you expect from the new release? You can expect what all software developers say their new releases contain:

  • More Power!
  • More Functions!
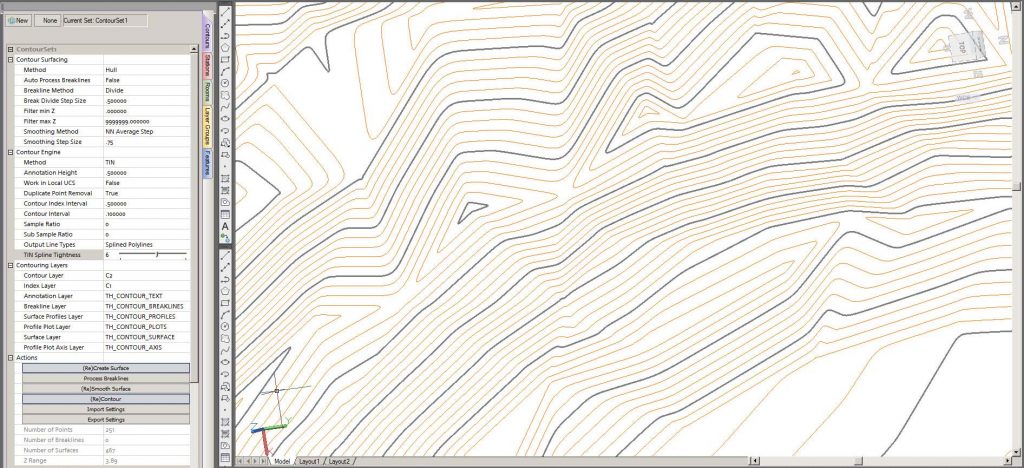
  • Easier to Use!Spline-smoothed-6_trimed

In this case it is true! TheoContour (we think) is one of the updates we are most proud of. The new features include:


  • New licensing System (easier to use, more reliable, better trial options).
  • PLY Import
  • Powerful Surface Smoothing Options
  • Powerful Line Smoothing Options
  • Better Layer Control
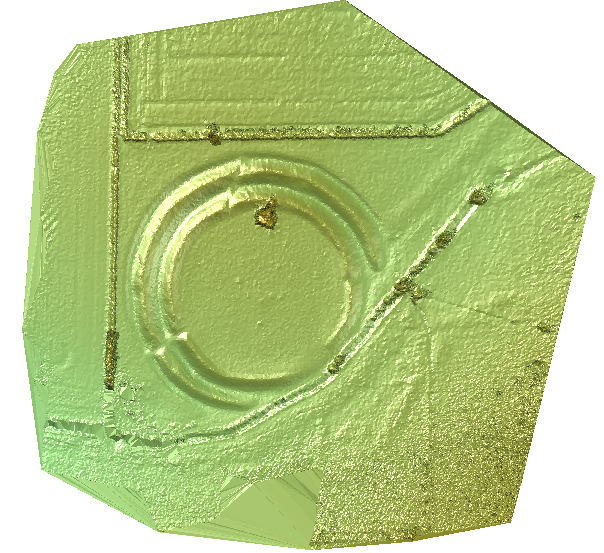
  • New Surface Creation Options with user definable colours.
  • Better memory management.

Surf ht shaded

Contact Us now for further details!

TheoContour: Fast Contouring made easy!

You can spend a lot of money on contouring, the software tools for surface interpolation and depiction do not come cheap and even the ‘inbuilt’ AutoDesk options require a hefty investment in a ‘Map 3D’ or ‘Civil’ variant. But there is a very effective and low cost option which I have been using for some time now and it’s proved itself to be a good ‘fast and dirty’ fix for getting contours done: TheoContour.

Like all of the Latimer CAD family of tools this is based on the premise of solving a CAD problem, not a surveying one: there are no data tables to code, no CoGo computations to step over and the outputs are pure CAD entities ready for your next DWG based task. And of course all is in 3D from the start.

Let’s start by looking at the results:

This composite view gives you an idea of what TheContour is capable of: annotated smooth 3D ploylines and shaded surface generation.

So how does it work?

TheoContour is an arx/brx application:

it works with points so getting started is easy: just get your points into AutoCAD! The points can be layered anyway you choose, and obviously, they need to be congruent in terms of height consistency ( in other words they have to be organised such that the Z values are correct!)

Once we are happy all the points are in the current view in WCS the 1st TheoContour command is : theocollate which loads up the points and reports on the surface they describe ready for the next step:

I kid you not, the arx processes this stuff pretty quickly 2,703 points in about 3 s!

Note that the command line report relays the settings we are using on this model. They can be changed easily; I’m not happy with contours at 4 to the metre indexed on the metre so I go to settings and switch the index interval to 5:

I’m now ready to contour:

The command is, you guessed it: theoContour! Plotting the contours takes a little time, this example takes about 45s to generate. Some models can take a while, it’s all dependent on how fine the contours are combined the entity type being generated (lines, polylines or splined polylines).

Not bad for a 1st pass, I would return to the settings and look at smoothing but this gives you a good idea of how simple the process is: and it’s flexible- in effect the datum is the zero value for Z in the current UCS so you can use theocontour to generate contoured surfaces indexed to any plane defined by a UCS! The contours are 2D ploylines in 3D space so they can be edited easily using PEDIT to get them tidy!

So just using 2 commands and tweaking the settings I have got working contours in minutes.

TheoContour also generates profiles and shaded surfaces, the text annotation is pretty neat too but for now I just want to show how simple contouring CAN be if you use TheoContour!

TheoContour for BricsCAD

TheoContour can be downloaded as part of TheoLt core at:…

http://www.theolt.com/web/theo-contour/

TheoLt: Powerful Flexible Features.

One of the great advantages of TheoLt compared to other survey software is it’s complete flexibility.  For example, lets take a look at the “Features Library”.

The basic premise of TheoLt is that it transfers the measurement information or point from a survey instrument (or Distance Meter) to CAD to be used by any command  (for example, draw lines, insert blocks etc). What the TheoLt Features Library enables is for a series of measurements to be combined to insert a series of lines, arcs or attributed blocks (much like standard survey “feature coding”).

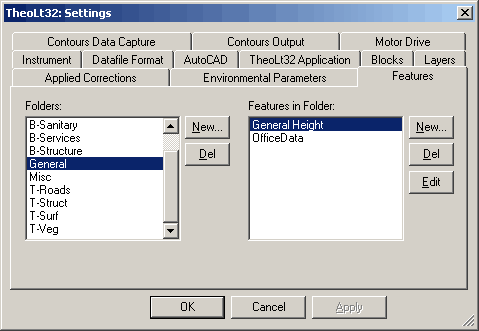
The feature definitions are accessed through the the settings dialog in the main TheoLt window. Definitions are grouped into folders.

Looking at it’s simplest use, inserting a single attributed block as a detail point. The first stage is to name the feature , define it’s icon and the number of measurements that should be taken to insert the feature. In this case, a single 3D measurement.

The next stage is to define any user attributes that may be required and whether confirmation is required (asking the user to confirm the values). Finally select the block to be inserted.

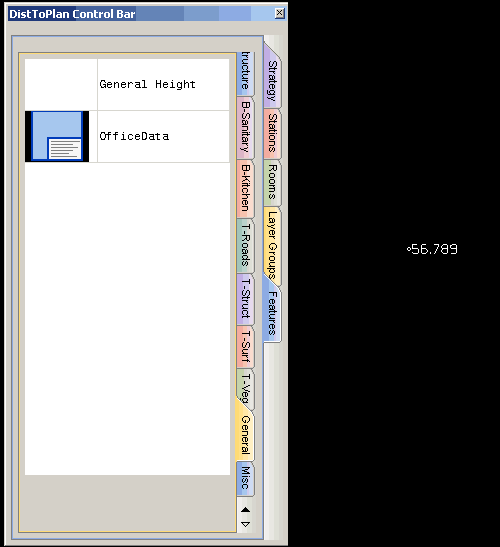
Once defined, opening the features panel will show the newly created item and a single click on the apropraite icon in the feature  palette will prompt for the measurement and the block will be inserted.

Next we can look at a more complex but typical use; kerbs tops and bottom in topographic survey. The aim here is to pick points on the top and the bottom of the kerbs, connecting the points, inserting blocks and annotating levels. This is very typical of topographic survey. Our definition will be point on top of kerb, point on bottom of kerb before moving on to the next part of the kerb.

Defining the feature, we name it and use 2 3D measurements with correct prompts. As we wish to join the points with lines, we will select “repeat insert” and join points on Layer (each point type having it’s own layer). This will allow the lines to be continued for as many measurements as required before exiting the command.  The attributes will be the Z-level of the first point only and two blocks will be inserted, each on it’s own layer.

Now when selecting the feature from the palate, the measurements are prompted, blocks are inserted and then the first prompt starts again. After the next round of observations, lines are drawn between the respective points on their designated layers. Options allow the lines to be curved, straight  and the alignment of the annotation to be altered or disabled.

The final example is a single complex item; a tree. To measure one fully quite a few measurements are required; the centre of the main trunk, the girth of the trunk, horizontal extent of the canopy and finally the vertical extent (height). These can be defined in the first window with prompts and measurement types. I would assume that for the first measurement the operator would take the angle to the centre of the trunk before taking the distance to the centre. This would leave the instrument pointing to the extent of the girth which we can collect as an angle only measurement. We can also choose to write the details out to a file which can contain any of the collected data fields for processing.

Next we will create the attributes where we will also collect the tree type which will be stored in a list to speed up the user input.

Finally we insert a block to represent the trunk – scaled to match the girth. A second block will be inserted, scaled to math the canopy.  An attributed block is inserted to hold the details of the tree (in addition to the file written above).

Obviously, this is not an in-depth analysis of what is possible from the features palate but I hope it gives some indication of the power within TheoLt.

TheoLt: The CAD in CADW Surveys!

This week I spent two wonderful days as a guest of CADW working at Chepstow Castle.

CADW site listing and…History of the Castle

The castle is a gem, and it was a privilege to be shown some of its secrets by the conservation experts I was working with. We had awful weather but we didn’t mind, as working together, we were able to get a good plan of the 2nd floor of Martens tower and, for me at any rate,  this is the finest kind of work there is!

The Architects Dept. of the national heritage body for Wales need surveys for site conservation and development. Following a demonstration at the Digital Past event in Cardiff earlier in the year the Architectural Technicians Team bought TheoLt Pro to work with their Leica 1200 series instrument.

I agreed to supply 2 days of  ‘on demand’ training for Paul Hayes, Michael Hopkins and Tony Kinson who handle a variety of challenging projects which need critical survey information in real-time.

Survey is a key tool in site development of any kind, and heritage sites have very specific survey needs. The CADW team get most of their survey done by contract survey companies working under a framework agreement, but there is a constant need to get small tricky areas surveyed quickly to kick off a design scheme for new visitor accommodation such as ticket offices, access pathways and the like.  Surveys need to be quick, in CAD, and annotated with levels in plan section and elevation.

The training session began with a quick assessment of training need and moved straight into practical procedures: getting a quick survey started using default orientation is a very useful way of getting the most out of limited site time, and the TheoLt ‘Default orientation’ option proved the point- once the kit is set up you can begin collecting precise 3D wire frame in minutes!

Its worth remembering TheoLt was designed for just this kind of scenario; a CAD plot of a single wall profile can make all the difference in project design and the software puts the absolute minimum between the surveyor and the CAD drawing. The CADW team are focused on solving project information needs and were impressed with the direct to DWG approach.

Working as training and support for Latimer CAD I find building a good relationship with TheoLt users rewarding and fun: its great to know CADW are able to get the most out of their 1200 now they can work with TheoLt!

We quickly worked through our training agenda:

  • Quick start
  • Preparing plans
  • the 3 methods of orientation
  • using UCS for 3d views
  • handling linetypes and line typescale
  • checking precision
  • level annotation using attributed blocks
  • toolbar customisation
  • working with AutoCAD alternatives- BricsCAD
  • TPS 1200 interface.  the pdf on this is here

Getting to know the ‘most wanted’ AutoCAD commands in surveying turned out to take up almost as much of our time as getting to know the TheoLt interface, this was no surprise to me as I know when TheoLt is used well it’s virtually invisible, making the job an AutoCAD one rather than a surveying one!

CADW need sections, levels and plans of the ‘hard to reach’ parts of their monuments and sites and this is just where the flexibility of TheoLt is an asset to the CADW team. At the very beginning of our session I was told the frequency of survey activity in the workgroup was very variable and they needed a method that is simple enough to pick up months after last use.  By the time we packed up at the close of the session I was cheered to hear user comment like ‘this is so much better that what we did before; you can see your mistakes as you make them!’

Driving home along the banks of the River Severn I was reminded of my first days doing CAD surveys and how often I would get stuck and have no help at all ( it was ‘PenMap’ in those days) and I look forward to the CADW teams first site survey with TheoLt because, of course, I’ll be there if needed to build the skills required; I have opened the door of opportunity for these surveyors and I am proud to have been invited to do so!

DistToPlan: Tools for building survey.

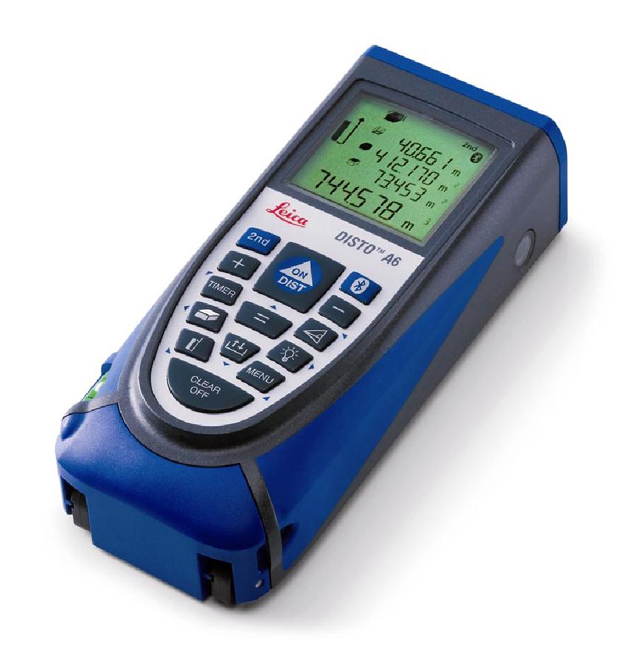
For quite a while now the Disto© has been the weapon of choice for surveyors doing 2D building plans, it has the huge advantage of being a one handed tool that replicates, in part at least, the familiar actions of ‘hand measurement’ viz, rod tape and dimensioned sketch. The big problem with the Disto© is that it doesn’t really automate the measured drawing process.

So simply put the Disto© problem is: ‘how do you get from measurement to drawing?’

We kissed our drawing boards goodbye a long time ago and in doing so started a process of making manual practices fit into CAD workflows. This has been an awkward at best but we can’t ignore the fact that CAD is the most important communication tool for measured graphic information today.

LatimerCAD Ltd has developed DistToPlan http://www.disttoplan.co.uk/ in conjunction with kubit Gmbh to bridge the gap between device and drawing.

Unlike almost any other surveying sensor, the Disto© generates data with no direction or position information. It is quite possible to use the ‘raw’ Disto© data to plot lines in CAD but this involves a great deal of  detailed command line entry to gain positional control of every distance measured. DistToPlan provides the necessary human interface with the drawing by automating as much as possible the geometry alignment procedures that are second nature in drawing board practice. Working with Disto became a lot easier with the advent of the Bluetooth interface which meant the surveyor doesn’t need 3 arms to operate CAD, Disto© and drawing together.

Having evolved over the last 5 years through extensive field trials and comprehensive commercial  testing a 4 method toolset has emerged which adresses the needs of the majority of measured survey practitioners. The final development strategy encompasses the 4 main methods surveyors use to produce plans:

1. Follow the wall – Where a line is plotted by fixed directions (up, down, left, right)  to enclose a perimeter and then brace with diagonals as a check.

2. Triangulation- The plan is determined by the intersects of arcs from a base, each base in turn linked by pairs of arcs.

3. Build up from boxes – Using the simplest plan form and then adapting it to conform to the measurements. ( In the manner of using squared paper to rule up the drawing)

4. Sketch & Measure – A freeform sketch is prepared and then scaled to fit.

DistToPlan will work in any one of these methods by placing the measurements into CAD when cued by the apropriate stage of the chosen method.

Let’s look at a number of common situations where DisToPlan works with the surveyors chosen strategy for measurement and CAD plotting:

Scenario 1: the plan is square and the scale requirement is relaxed (1:100 ‘outline’ survey) and there is a need to build up a building plan quickly.

By using the ‘Rectangular Room’ command the Disto measument is handled as follows, note that the 2 requests for the diagonal  have been ignored with an ‘enter’ stroke:

And the correctly scaled rectangle is placed in CAD. The next room is measured in the same way and placed by using a wall thickness offset:

The room is placed and the alignment point and direction selected:

Once you are happy with the align pint and direction bring the new room into line with the 1st one:

Click to select and the wall offset prompt lets you put in the wall thickness:

So using the rectangle room command we can build up a basic plan very quickly. Now we all know just how rare a rectangualr room plan is! So the next step is to develop the rectangle using the ‘square feature’ tool:
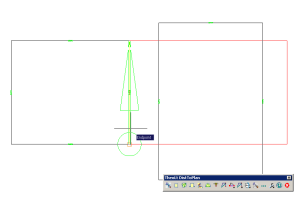
The measurments are sent to the command line at the appropriate prompts and the side of the wall the feature is placed is selected by a pick in the graphics area:

This is the ‘build up from boxes tool’. The room outlines can be aligned in any state but its probabaly best to get the edits for each room done in turn to make the alignments easier. How features are added is shown in Scenario 3 below.

Scenario 2 : The room has a complicated plan and the surveyor wants to be sure of the perimeter shape before measuring, the survey needs ‘free hand’ drawing in AutoCAD.

DistToPlan now has a unique Sketch & Measure tool which will allow a sketch plan to be measured and scaled after drawing. Here’s one way of using it:

Zoom scale to 10x (assuming you are starting from scratch)

This will get your aproximate drawing size close to ‘actual size’.

Select the Sketch & Measure tool and note the custom cursor view: you are now working in an automatically grouped line set with a nominal snap running; the comstraints on placing the line can be adjusted in the sketch panel which pops up on use of the command. The grid and snap weighting are controlled by the pop up panel.

The panel should be kept open throughout preparation of  the sketch as you may need to reset the grid step to get the sketch right. The grid value is reset by a click in the graphics area. Sketch out the plan with the ‘rubber band’ line. The sketch is not just a simple line, DistToPlan stores the lines as a group ready for interrogation by  measurement.

Once you are happy with the sketch the perimeter line is finished with a ‘close’ option from the right click context menu ( or ‘C’ in the command line)  the measure panel will open and measurement can begin. Measurements are added for each line, in any order,  on selection the command line prompts for the distance and also relays the CAD distance  as a rough check.

Missing ties can be added to the plan and measured in with the Add Brace option on the panel. For error distribution DistToPlan needs to have 2 fixed points in the plan and these can be identified at this stage with the Fix Pt option.

The measured lines are anotated with the distances entered at the command line, the  selected line for measurement is highlit with a custom pointer:

The direction of the pointer indicates the end of the line that will be adjusted as well as the direction of the anotation text.
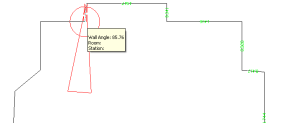
Choosing the  fixed points  (or line): To work, the distributed error maths needs 2 fixed points. For best results the should be located on a long wall opposite the closing point. (At the present release, if fixed points are chosen at the start /close of the loop things can go awry).

On completion of the measure sequence selection of the  finish option on the Measure panel runs an error distribution routine (theofitclosed) and, if the figure is within toloerance, it will be adjusted by least squares to close the perimeter. The shift caused by the adjustment is recorded in the drawing by the plot of the node positions (green and blue by default) before and after adjustmet in apropriate layers.
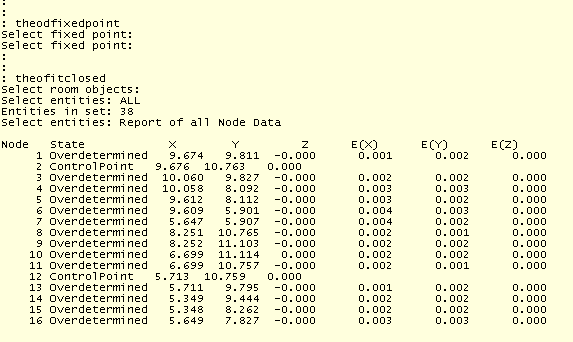
A report is generated and sent to the command line showing the condition of the adjustment.

If needed,  the room can be treated as part of the building plan, at any stage after measurement and the adjustment done at a later time.

Scenario 3 : A FM plan is needed with full anotation of services by use of standardised symbol libraries. To keep track of the operations needed in each room to be measured.

DistToPlan offfers a ‘strategy’ template on the tool pallette. Eash command set needed is prompted by picking off the step on the pallette.

DistToPlan is supplied with a pallette menu which is used to perform 2 key functions.

1.To give acess to the symbol libraries and

2 To control the organisation of the measured data for grouping ( by room, floor plate etc.) so that, if desired, network adjustment by total station can be applied.

The basic plan can be built up using the apropriate measuring tool (e.g the ‘square room’ and align commands used in scenario 1) .

The anotations are added for floor and room height using the prompt from the pallette. Site notes can be added using the add note tool which will attach a reference of a Journal note file or image to the DWG for easy acess to additional information collected by bluetooth camera or site sketches. DistoToPlan will send the new files and prompt to insert them into the project / drawing.

In addition DistToPlan logs the Disto data in a time stamped data file which can be used for either drawing recovery or QA, stores the room geometry for room by room network adjustment if required and supplies a customisable attributed block library for direct DWG insertion.

For full heighting, corner closing and 3D work with a total station TheoLt Building Survey Suite is recomended.

About DistToPlan DistToPlan is available forAutoCAD (full and LT) versions as well as (with some reduced functionality) the AutoCAD alternative BricsCAD from v10 on.

Disto© is a registered trademark of Leica Geosystems Gmbh.

DistoPlan is a registered trademark of LatimerCAD and kubit Gmbh.

TheoLt is a registered trademark of Latimer CAD and English Heritage

AutoCAD is a registered mark of Autodesk Inc.

BricsCAD is a registered mark of Bricsys nv