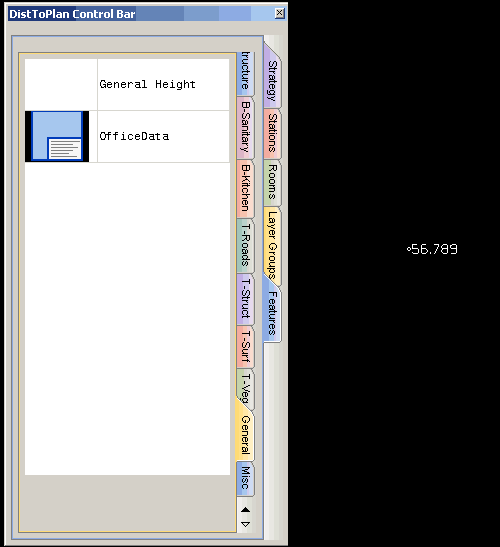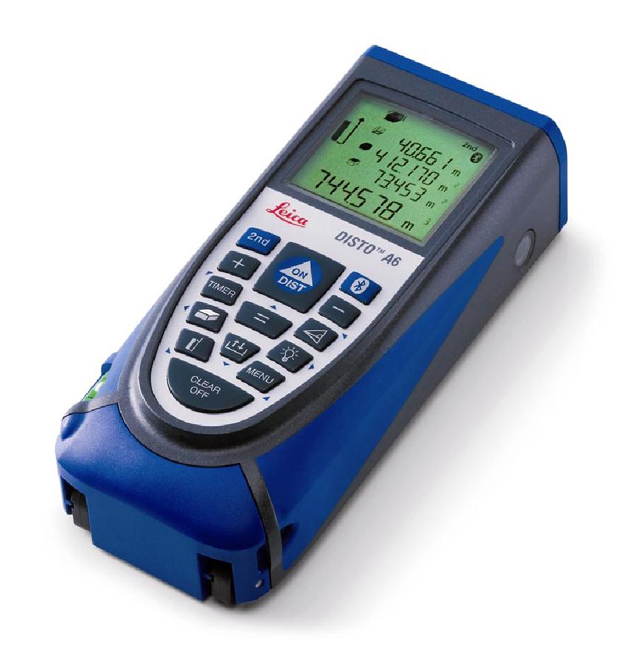
What is the difference beteween Leica’s Disto to CAD tool and DistToPlan?

The Leica DISTO transfer has been available now for a while on both AutoCAD and BricsCAD.

With the advent of the new cheaper Bluetooth Distos (3aBT) which includes this free tool I would expect far more surveyors to be investigating the transfer of measurements direct to CAD whilst on site.

So, what is the difference between this free tool and DistToPlan (which of course is not free)? I will compare like with like. The Leica tool is only a communication agent so I will compare this with the DistToPlan agent.

Configuration:

DistToPlan works with any Bluetooth driver by default. All that is required is to select the virtual com port ( ports 1 to 8 ) and connection will be established. With the Leica system, if the the bluetooth driver is neither the Broadcom or Microsoft drivers an additional configuration program must be run to allow  manual connection to be established. If the correct drivers are installed the Leica software will automatically find the Disto.

The DistToPlan agent is an external EXE, selecting the settings enables the CAD Platform to be selected (AutoCAD, Bricscad or InteliCAD). In addition DistToPlan my be customised to send the measurements to almost any Windows application. Only AutoCAD® versions from 2004 and BricsCAD® versions from 9.3.5 are supported by the Leica PlugIn.

In Use:

The Leica system allows customisation of the Disto device such as units remotely which DistToPlan does not.

Both applications transfer the measurements direct from the Disto to the CAD command line as if they were typed. The main difference is that DistToPlan also stores the previous measurements (and angles, see below), meaning that the command in CAD need not be active as you measure, it is possible to measure the room and then sit at the laptop picking the correct dimensions for each line.

With the 2nd fn key pressed on on the Disto, both systems allow the angle of the line to be controlled from the Disto whilst measuring.

One further function that does not seem to be offered by the Lecia software is remote trigger. If you wish to use the Disto on a pole for example, DistToPlan is able to trigger a measurement remotely.

The extent of the Leica software is simply data transfer. DistToPlan adds a full set of commands to the CAD system to enable construction of building plans far quicker than just utilising the basic CAD commands. Examples of this may be seen here…

DistToPlan may be downloaded here…

A record survey by PhoToPlan

Drainage problems with the pavement on the gun deck of Martello Tower 24  this tower required a full record of the historic paving prior to lifting for English Heritage.

This is a rectified montage of the gun deck pavement and firing step of a Martello tower. It was achieved by 4m PAP (Pole Aerial Photography) in a single day on site. The pavement  level is  a stitch of 9 images, the firing step  12. The images were rectified in PhoToPlan and then balanced and feathered in Photoshop.

Control for the rectification was by REDM to detail points collected in TheoLt:

In this plan I plotted the wall top from intersection in PhoToPlan 3D, orientated to the same control points from our reconaisance KAP imagery:

This tower is impressively armed with a mighty 24pdr; we had to wait until it was lifted before we could record the pavement condition in advance of works to stop the leaking, visit when it rains and you get wet!

Once the pole is set up and the rig hoisted it’s a case of working as quickly as possible to get even illumination across the whole photo block…and taking advantage of rare moments of excitement like the bit where we have to negotiate the flag pole.

For completeness the pavement survey was required to cover the firing step so the images are rectified again but this time to the firing step plane. The control points are snapped onto the joint lines from the TST survey by TheoLt. 12 images got me around the ring.

I had hoped there would be a deep enough chord of the circle covered in each shot to make use of the minimum number of points I measured to describe the jointing of the circumference rail support blocks, this turned out to be the case but more points would have been better, some of the projected images came out a bit stretched!

Next the central pivot column is rectified so that the final montage is presented to a consistent scale:

The pivot post is easy: 6 points and its done! Bringing the pieces together completes the cover:

The 3 planes are combined into one single orthographic projection, there was a great deal of fitting needed to get the coverage of the pavement right up to the base of the central pivot post from oblique imagery taken with the pole on the firing step.

Re-inserting the montage back into AutoCAD and checking by PhoToPlan rectification showed a 9mm average discrepancy between the montage and the control points.

This documentation project is a great example of what can be done with PhoToPlan, Photoshop, AutoCAD TheoLt and….

…a camera on a stick!…

So in 4 easy steps we got from ‘no cover’ to ‘ortho’ cover.

PhoToPlan3D: Understanding precision

PhotoPlan3D= Simple photogrammetric plotting in AutoCAD!

PhoToPlan3D by kubit makes 2 useful aspects of photogrammetry available for AutoCAD users: 1st  plotting from 2 (or more) images by intersection in 3D and 2nd plotting by projection from single images on to a plane. When used together the PhotoToPlan3D toolset enables the use of non metric imagery for surprisingly good results as a data source in AutoCAD.

Ther are 3 main aspects to getting the best out of PhoToPlan 3D: Control, Image condition and image orientation.

The first thing is to get a grip on is the relationship between the image and the control required to orient it. Let’s look at the control 1st.

The distribution of control points should be as wide as possible but should not rely on clusters in the centre of the area to be mapped. The number of control points is on the high side if you are used to using the minimum of 4 in PhoToPlan2D, the minimum of 9 points seems to be a bit tiresome but the benefits of the higher density of control will be worth it! If you imagine the task as filling a ‘data hole’  a good distribution of points would be not only around the edges of the hole but in the hole itself too! There are 3 basic rules on control points:

1. The more the merrier, 9 points per image is the minimum!

2. A wide distribution is better than not and

3. The closer to the data area the better

The condition of the imagery has a big effect on the precision achievable; this can be characterized in 4 elements:

1. The disposition of the images. If the images are captured from camera positions too close together or too far apart the intersection of rays between them and the object space will be either too obtuse or too accute, it helps to think in terms of a 90 to 60 degree intersection as ideal. If the stand-off from the camera to the subject has too great a variance the results will be poor. PhoToPlan3D will give you results from poorly conditioned imagery but the precision will proportionally poor too! Big X,Y rotations between images are not a problem although its helpful to resolve this at insert.

2. The convergence of the images. You will get nowhere if the images are not covering the subject area! Also if they point at the subject too obliquely you will find it hard to find common points between the images when plotting.

3. The consistency of the images. Ideally image pairs should be from the same camera and lens. It’s difficult (but not impossible) to achieve good intersections when one image is taken with a wide angle lens and the next with a telephoto.

4. Camera calibration information. If camera calibration data is available it should be used; PhoToPlan3D works with an ‘inverse’ calibration based on an assumed focal length, if the true focal length can be used the precision is better.  Relying on the image EXIF data is not enough.

Image condition: this is a poor case as there is not only a big’ Z’ shift, but also severe tilt between the 2 images.


The quality of the image orientation depends on a combination of the image condition and the control quality. The image orientation panel is very flexible and it can be used to experiment with control point configurations point by point to see what gives the best result.

The image orientation panel. You can add more control points, take them in and out of the calculation and see the worst case point at any time after adding the 1st 9 points.

It’s worth noting that the constellation of control points used will change as new points are added, the precision (as reported by the standard deviation) may well decrease beyond a certain number of points and the reported worst case point will change: experimentation here pays off. The effect of adding new points can be to dilute the precision!

Tip if you are using imperial units in AutoCAD the ‘Deviation’ results will not be easy to read as the scores will be fractions of an inch. Set the AutoCAD units to decimal with at least 4 decimal places to see the scores!

Refining the image orientation The initial 9 points for the first image may be the only points you have but if you are working with a point cloud or existing 3D survey data its well worth adding more points and testing  which configuration of points works best. Its simply a case of holding off hitting the ‘Create orientated image’ button until the standard deviation is as low as possible.

Let’s look at the orientation procedure in detail:

The image pair and the control: in this case the control is from an existing survey A number of control points have been marked ready for image orientation. (data suppled by English Heritage, used with permission)

With the 2 images loaded on a convenient UCS and the control points marked the next step is to open the  Image Orientation panel and begin to add control points to the orientation, this is done by point matching between the image and the control.

Tip: the deviation scores are not displayed until the destination image name has been set.

Adding control points to the orientation.

Note on precision: The standard deviation (SD) refers to the performance of the fit between the image and the control geometry. If the SD of two  image orientations is 1cm each it can be expected that the resultant precision when plotting between then will be roughly double the SD i.e: 2cm per point.

The orientation will complete with the Create orientated image function and it is presented in CamNav view:This example is a good one to look at the registration across the image area. The control points are mostly in the centre and left side of the image, the fit is poor around the edges ( particularly at the apex of the pediment on the right). The distribution of control points could be better!

Reducing the plan rotation  in the pair improves precision. By increasing the density of control points and choosing images with less tilt between them the precision is improved but the quality of the pair in terms of parallelism with the subject seems to have a big impact on the precision of digitised lines. Here I have loaded 2 images with more vertical displacement but less convergence :Despite the deep Z shift between them these two images have a better parallelism. The orientation SD was refined by selecting 18 points and deactivating the worst fit point and then adding new points (this worked better than juggling the relative fit of the 1st 18) the SDs came in at 10 and 9mm. Here are 2 pairs with different characteristics:

The relative plan rotation of the images seems to be more important then the tilt or depth displacement. Surprisingly in the 2 pairs above I got far better results with pair 1 than pair 2, pair 2 is a significantly convergent case whereas pair 1, despite the big Z shift and vertical tilt has better parallelism.


By repeating the image orienatation and testing lines (in blue in the screen shot) against the control point psositions I can gain confidence in the pair. Pair 2, despite comfortable SD scores  (11 and 12mm), plots consitently dispalced by 2-3cm.

The difference in the performance of the 2 pairs can be explained by the planar orientation; the best pair were taken in parallel and worked well even though they have a big stand off variation.

It’s a good idea to experiment to find the best image condition. One of the  great strengths of PhoToPlan 3D is the flexibilioy you have to try things out and see what the resukts are like before you commit to plotting. Having got the orientation refinement method practised and making sure there is an abundance of control and imagery available means the optimum image condition can be found. The classic 3X3 rules (contained in this pdf) still hold for photogrammetric capture but it seems that PhoToPlan3D works best with near ‘square on’ imagery!

Pointclouds in AutoCAD 2011

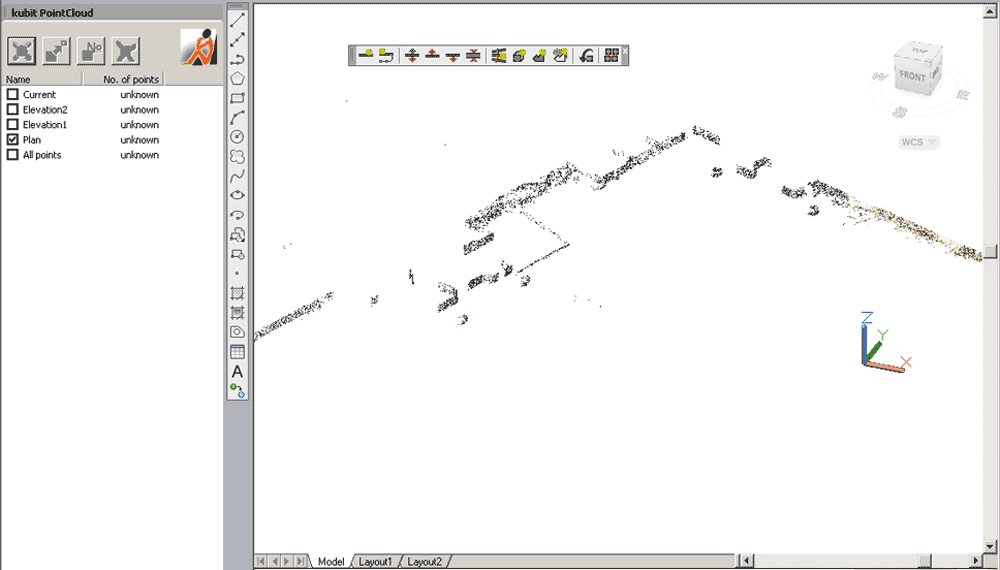
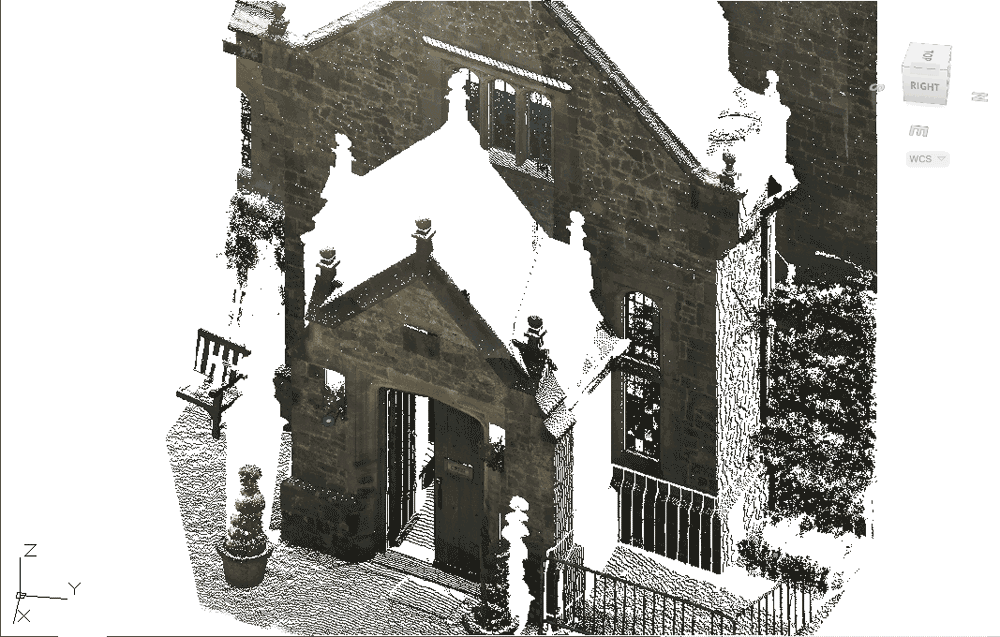
One of the (much hyped) new features of AutoCAD 2011 was the inclusion of handling pointcloud data. In this post we will take a quick look at this functionality and how you can make real use of this.

The first issue is that AutoCAD can only read specific (limited) pointcloud formats; LAS, XYB and the 2 Faro formats FLS and FWS. Many users will find this a limitation and need further formats. Further formats may be imported by adding the free version of PointCloud from kubit. The product page is here and the software may be downloadedhere. PointCloud adds the formats PTZ, RiScan Pro and ASCII (CSV, TXT etc).

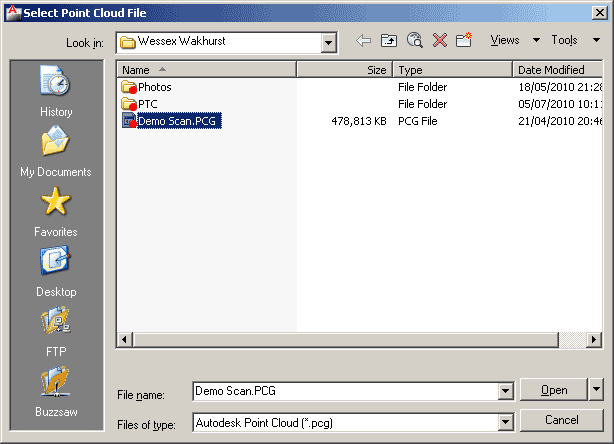
The workflow of importing pointcloud data is to first index the supplied file to create a PCG file which is Autodesk’s pointcloud format.

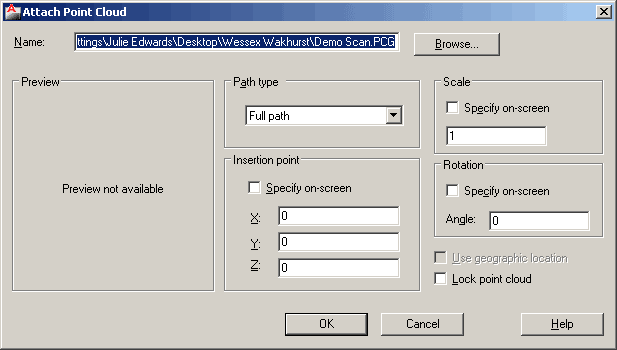
This PCG file may be attached in the same way as any other AutoCAD block or image file.

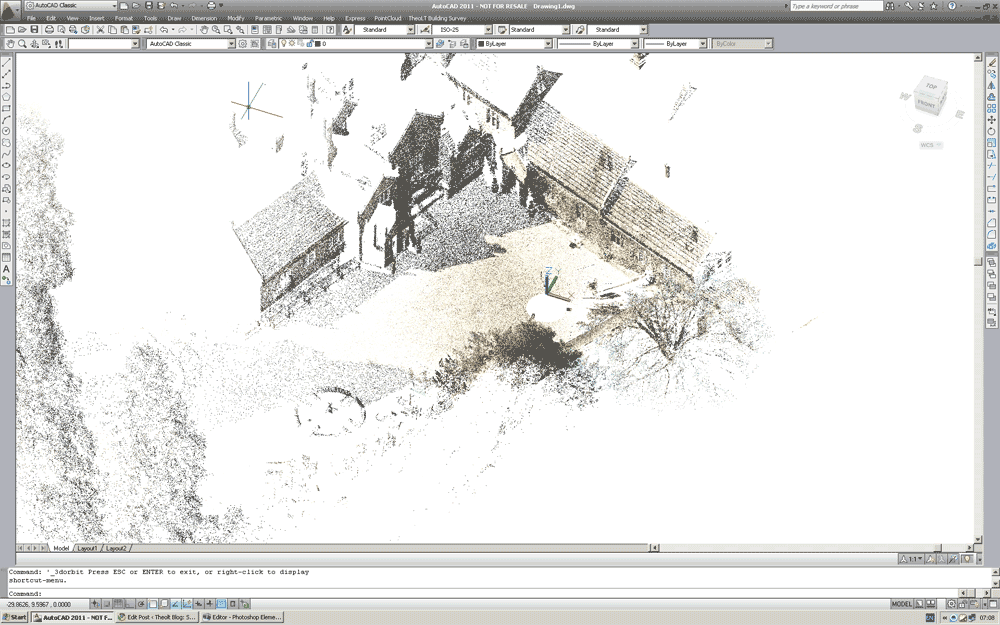
The method of display of the points depends on the current AutoCAD Visual Style. A 2D non-rendered (2D) style displays all of the points in a single colour: black. Selecting a rendered (shaded / 3D) style displays the points in colour.

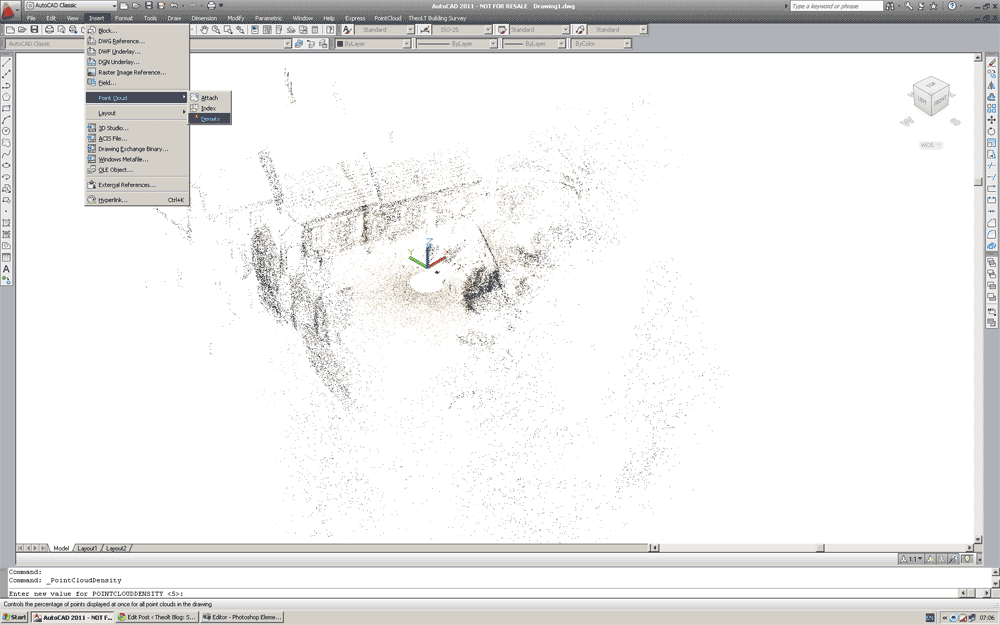
AutoCAD manages the number of points displayed on the screen. At first loading the density of the points displayed may appear rather thin. Select the density command. Here I have set the value 70. The display is now far more usable. You will find the pan and orbit are very quick and all points within the cloud may be via the Node object snap.

Many will view the fact that AutoCAD can only display the whole cloud or no cloud as a major limitation, this is another limitation that may be bypassed with kubit’s PointCloud software although this further functionality requires the paid version.

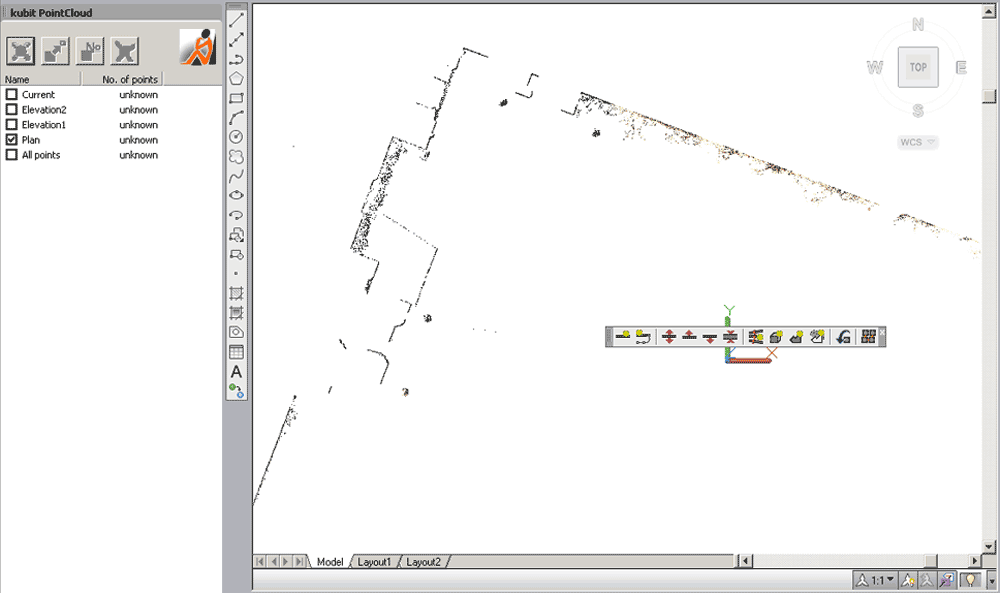
PointCloud allows the definition of sections which may be managed in the section manager. These may be created in the following ways;

  • Slice
  • (Shift slice up/down and change slice thickness)
  • (Multiple slices: Parallel or perpendicular to objects/curves)
  • Clipping Box
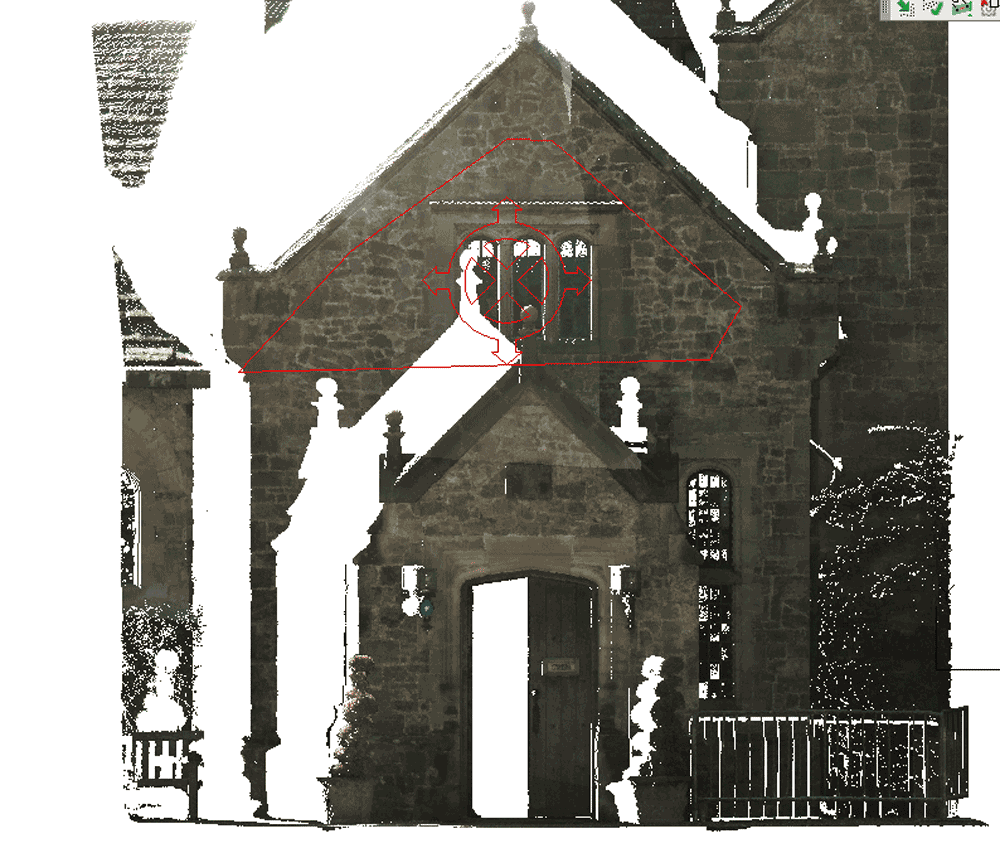
  • Clipping Polygon (2D projection, inside or outside remains visible).

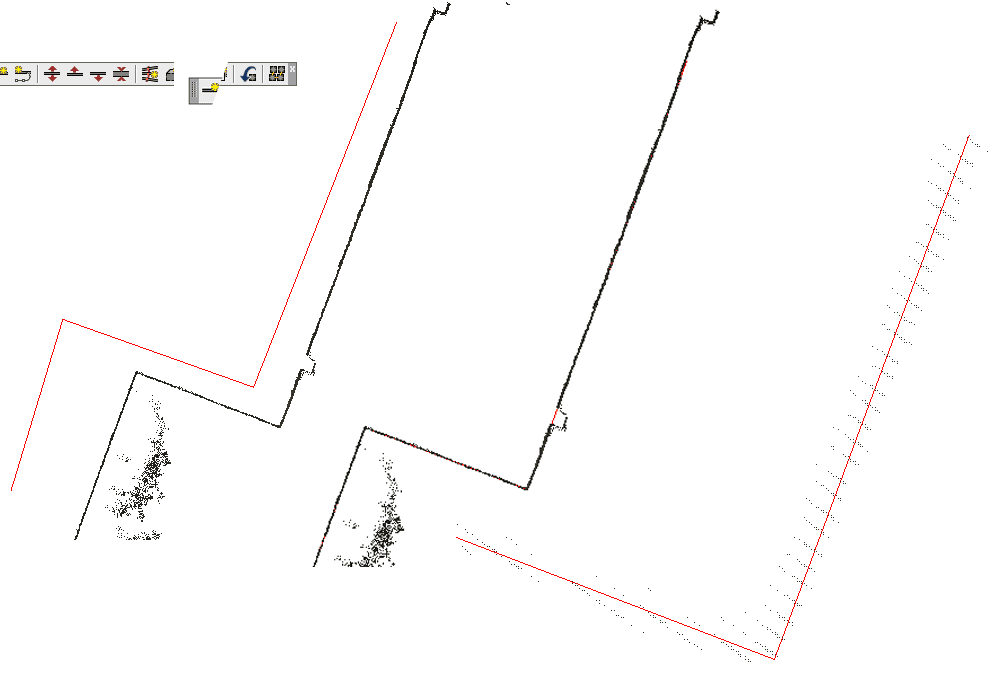
A typical use of the slice command is to create a plan.

This of course may then be traced. If the version of PointCloud being used is the Pro version then the Automatic Fitting may be used to fit the plan to the slice. This is completed by drawing a very approximate polyline (with the correct number of corners) and selecting the Fit Polygon command.

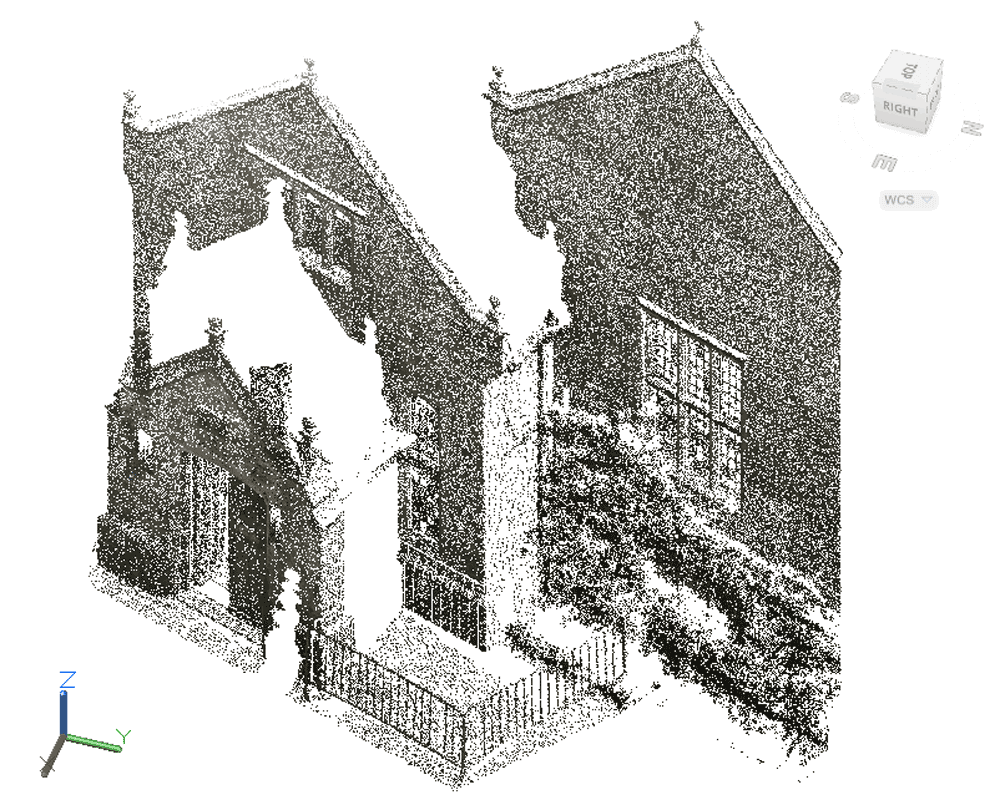
Working with elevations is a key use of PointCloud data. This however shows another weakness in the AutoCAD  pointcloud display. The density of the data displayed may not be sufficient for tracing details.

Again, PointCloud may come to the rescue here. Using the section manager individual sections of the data set may be saved in PTC format – the native format of kubit’s PointCloud (which enables the support for PointCloud data in AutoCAD’s prior to 2011). The display of the PTC is far denser allowing the details to be seen clearly.

Edit/Note: Release 7, released in May 2011 introduced “SmartSections” a new way of creating and working with this higher density display. The new SmartSections are faster and simpler to use. End Edit/Note.

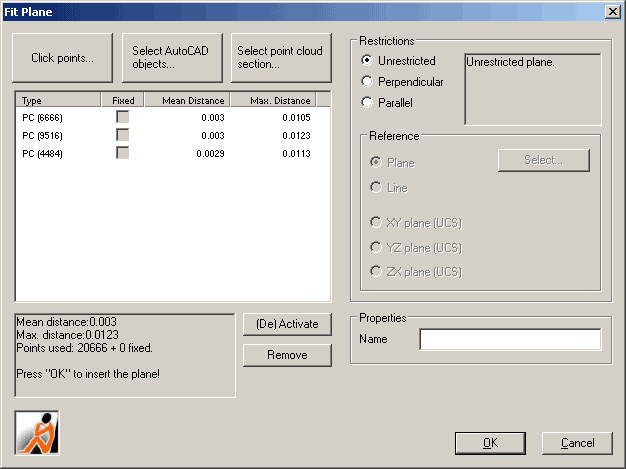
A further tool within PointCloud is Plane fitting. This enables a plane to be fitted to a number of points and in the case of elevations, the UCS placed on this plane ensuring the elevation is drawn in the correct position.

At first glance it may seem that are are too many disadvantages to using the Autodesk PCG engine and other tools provide a better solution. However when you consider that the PCG engine allows up to 2 billlion points to be inserted into AutoCAD I would suggest that PCG + PointCloud is the ideal tool to manage the dataset within AutoCAD, creating overall plans and views.  with sectioning the data to PTC sections for detail extraction. Take time to download and evaluate PointCloud, again details here.

TheoLt: Powerful Flexible Features.

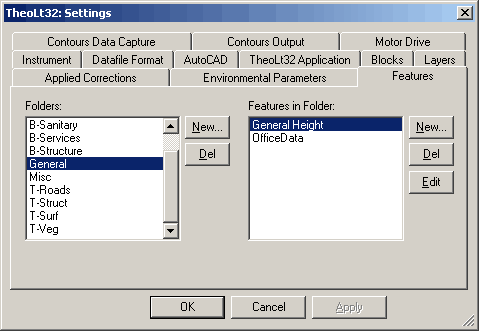
One of the great advantages of TheoLt compared to other survey software is it’s complete flexibility.  For example, lets take a look at the “Features Library”.

The basic premise of TheoLt is that it transfers the measurement information or point from a survey instrument (or Distance Meter) to CAD to be used by any command  (for example, draw lines, insert blocks etc). What the TheoLt Features Library enables is for a series of measurements to be combined to insert a series of lines, arcs or attributed blocks (much like standard survey “feature coding”).

The feature definitions are accessed through the the settings dialog in the main TheoLt window. Definitions are grouped into folders.

Looking at it’s simplest use, inserting a single attributed block as a detail point. The first stage is to name the feature , define it’s icon and the number of measurements that should be taken to insert the feature. In this case, a single 3D measurement.

The next stage is to define any user attributes that may be required and whether confirmation is required (asking the user to confirm the values). Finally select the block to be inserted.

Once defined, opening the features panel will show the newly created item and a single click on the apropraite icon in the feature  palette will prompt for the measurement and the block will be inserted.

Next we can look at a more complex but typical use; kerbs tops and bottom in topographic survey. The aim here is to pick points on the top and the bottom of the kerbs, connecting the points, inserting blocks and annotating levels. This is very typical of topographic survey. Our definition will be point on top of kerb, point on bottom of kerb before moving on to the next part of the kerb.

Defining the feature, we name it and use 2 3D measurements with correct prompts. As we wish to join the points with lines, we will select “repeat insert” and join points on Layer (each point type having it’s own layer). This will allow the lines to be continued for as many measurements as required before exiting the command.  The attributes will be the Z-level of the first point only and two blocks will be inserted, each on it’s own layer.

Now when selecting the feature from the palate, the measurements are prompted, blocks are inserted and then the first prompt starts again. After the next round of observations, lines are drawn between the respective points on their designated layers. Options allow the lines to be curved, straight  and the alignment of the annotation to be altered or disabled.

The final example is a single complex item; a tree. To measure one fully quite a few measurements are required; the centre of the main trunk, the girth of the trunk, horizontal extent of the canopy and finally the vertical extent (height). These can be defined in the first window with prompts and measurement types. I would assume that for the first measurement the operator would take the angle to the centre of the trunk before taking the distance to the centre. This would leave the instrument pointing to the extent of the girth which we can collect as an angle only measurement. We can also choose to write the details out to a file which can contain any of the collected data fields for processing.

Next we will create the attributes where we will also collect the tree type which will be stored in a list to speed up the user input.

Finally we insert a block to represent the trunk – scaled to match the girth. A second block will be inserted, scaled to math the canopy.  An attributed block is inserted to hold the details of the tree (in addition to the file written above).

Obviously, this is not an in-depth analysis of what is possible from the features palate but I hope it gives some indication of the power within TheoLt.

TheoLt PRO: Traversing

These days big traverses are becoming a rarity. The GPS active net is doing a better job for many survey projects. Traversing is still the best way for getting good control for small sites, setting out, architectural photogrammetry and building survey. I remember the happy time at field school in Wales with booking sheet and pencil, baking in the summer sun, each station in turn becoming a kind of holiday home as we carefully logged back-sight and foresight obs. We got to live outdoors and enjoy it. So, given that this is the backbone of my work, why do I hate it so much?

It is the inevitable disappointment when, at computation, I discover the blunders! All the wonderful effort of getting stations set out, carrying forward heights, multiple obs is lost when the numbers don’t come out! Each time I set out to traverse I have the optimism of a child on a trip to the seaside only to face the bitter disappointment of having to repeat the work to get it right. This is something I have grown used to: traversing is a game of errors and I have, over the years, found out how to get the results I want. In truth I have never been happy with simply surveying for numbers, for me I want to see a drawing, detail, I want that map to grow, to make my mental map real; a schedule of co-ordinates to me is no thing of beauty. So what to do about it?

I can’t do my job without control; I’ll never forget the wise words of Peter Waldhausl when I asked him the teacher’s question: ‘what is the single most important thing to teach in survey?’  his answer, without hesitation, was very clear: ‘NO ACTION WITHOUT CONTROL!’

It’s thrilling to drive in the first peg on un-surveyed territory, this is without doubt part of the elemental appeal of surveying (it’s certainly is NOT the money…few of us are well paid and even fewer of us manage to keep our jobs!) we are part of making the unknown known in a very real way. Anxieties about control can be helped by getting the right tools and first and foremost in these tools is software! I use real-time software that tells me where I’m going wrong when I make the mistakes. Now I know this is not proof against blunder but it definitely helps! Keeping track of where the errors are is one thing but I’m amazed at how much gets in the way of your best rehearsed procedures when you are traversing: for crying out loud there are only 4 things to do:

1. Log the instrument and target heights of collimation (HoC).

2. Achieve and verify orientation.

3. Observe and book shots to back-sight & fore-sight.

4. Set out new station as required.

So what goes wrong?

Plenty! You forget which station you are at and use the wrong station ID, you set out a station then find the sight-line blocked, somebody ( it’s never you!) kicks a tripod and you have to re-set the HoC and retake the station orientation, you select the wrong HoC for the orientation shots, you forget to take the last angle in the loop because you think you already have the shot done as you have ‘been here before’ not to mention the lost marks, last minute datum changes, miss-matched tribrachs, ‘helpful’ people moving setups before they are measured, it starts raining etc.

The software definitely helps, I have a strong tendency to argue with it but I’m learning to trust it (yes I’m pretty stubborn like that I’m afraid).  The Netadjust tool in TheoLt Pro is what keeps my traverses on the straight and narrow.

It has some really good ‘idiot proof’ features which this idiot has learnt to adopt as procedural reinforcement:

Real-time feedback of station selection at occupation and orientation. I get a ‘heads up’ message on completing an orientation that advises me of the staion IDs, the HoCs and the precision of the orientation.

Automatic prompting of HoCs. Every time I take shot to a target I get a prompt, I can turn this off, but this is my most common foul up, its very difficult to ‘unpick’ HoC errors even though it is usually very easy to see where they occur.

Traffic light coloured observation results. This really is the best bit for me, TheoLt will let you know how good your shots are as you take them, you can drop the ‘bad’ obs from the computation, re-shoot or go right back and re-do the orientation again.

Automatic target ID. When you shoot a target with a known position you are prompted with its ID, a simple hint saving a mountain of time searching through tables to find a station ID.

Live diagram. I can preview my loop in AutoCAD/BricsCAD at any time; if it don’t look right it ain’t right. The diagram tells the story.

Non destructive back-up of raw data.  You can run the calc and see what happens at any point in the loop and still have the original observation data logged for QA.

Least squares distribution of error. TheoLt through its partnership with kubit uses a powerful network adjustment algorithm. By moving away from Bowditch (sob!) towards a distributed error network the traverse can be extended to include resections.

TheoLt orientation procedure builds the network data table which shows how good the shots are, how many shots there are in the set and allows you to include or exclude a shot from the computation. I can get reports out on the condition of the network when I run the calc to test the impact of the include/exclude options I use:

Let’s take a look at the report:

TheoLt NetAdjust does traversing nicely but there are drawbacks, its not something I would expect the whole survey world to use. It’s dependent on a PC so its not going to be what I would use on a windswept fellside in driving rain. For me it’s a godsend simply because I can get good control without fuss and move on to what I want to do…draw!

Control networks are essential for a complex building plan. The exterior can often be controlled by a fairly traditional loop with some fun & games to accept GPS points. Once tied to the exterior loop the interior can usually be fixed by resection throughout.

There is always something that gets in the way!

A control network needs to provide points with a higher order of precision than simple polar observations. Easy to say, a fiddle to do, but a whole lot simpler with TheoLt!

www.theolt.com

More on the TheoLt story here:

http://www.caduser.com/reviews/reviews.asp?a_id=187

TheoLt: The CAD in CADW Surveys!

This week I spent two wonderful days as a guest of CADW working at Chepstow Castle.

CADW site listing and…History of the Castle

The castle is a gem, and it was a privilege to be shown some of its secrets by the conservation experts I was working with. We had awful weather but we didn’t mind, as working together, we were able to get a good plan of the 2nd floor of Martens tower and, for me at any rate,  this is the finest kind of work there is!

The Architects Dept. of the national heritage body for Wales need surveys for site conservation and development. Following a demonstration at the Digital Past event in Cardiff earlier in the year the Architectural Technicians Team bought TheoLt Pro to work with their Leica 1200 series instrument.

I agreed to supply 2 days of  ‘on demand’ training for Paul Hayes, Michael Hopkins and Tony Kinson who handle a variety of challenging projects which need critical survey information in real-time.

Survey is a key tool in site development of any kind, and heritage sites have very specific survey needs. The CADW team get most of their survey done by contract survey companies working under a framework agreement, but there is a constant need to get small tricky areas surveyed quickly to kick off a design scheme for new visitor accommodation such as ticket offices, access pathways and the like.  Surveys need to be quick, in CAD, and annotated with levels in plan section and elevation.

The training session began with a quick assessment of training need and moved straight into practical procedures: getting a quick survey started using default orientation is a very useful way of getting the most out of limited site time, and the TheoLt ‘Default orientation’ option proved the point- once the kit is set up you can begin collecting precise 3D wire frame in minutes!

Its worth remembering TheoLt was designed for just this kind of scenario; a CAD plot of a single wall profile can make all the difference in project design and the software puts the absolute minimum between the surveyor and the CAD drawing. The CADW team are focused on solving project information needs and were impressed with the direct to DWG approach.

Working as training and support for Latimer CAD I find building a good relationship with TheoLt users rewarding and fun: its great to know CADW are able to get the most out of their 1200 now they can work with TheoLt!

We quickly worked through our training agenda:

  • Quick start
  • Preparing plans
  • the 3 methods of orientation
  • using UCS for 3d views
  • handling linetypes and line typescale
  • checking precision
  • level annotation using attributed blocks
  • toolbar customisation
  • working with AutoCAD alternatives- BricsCAD
  • TPS 1200 interface.  the pdf on this is here

Getting to know the ‘most wanted’ AutoCAD commands in surveying turned out to take up almost as much of our time as getting to know the TheoLt interface, this was no surprise to me as I know when TheoLt is used well it’s virtually invisible, making the job an AutoCAD one rather than a surveying one!

CADW need sections, levels and plans of the ‘hard to reach’ parts of their monuments and sites and this is just where the flexibility of TheoLt is an asset to the CADW team. At the very beginning of our session I was told the frequency of survey activity in the workgroup was very variable and they needed a method that is simple enough to pick up months after last use.  By the time we packed up at the close of the session I was cheered to hear user comment like ‘this is so much better that what we did before; you can see your mistakes as you make them!’

Driving home along the banks of the River Severn I was reminded of my first days doing CAD surveys and how often I would get stuck and have no help at all ( it was ‘PenMap’ in those days) and I look forward to the CADW teams first site survey with TheoLt because, of course, I’ll be there if needed to build the skills required; I have opened the door of opportunity for these surveyors and I am proud to have been invited to do so!

DistToPlan: Tools for building survey.

For quite a while now the Disto© has been the weapon of choice for surveyors doing 2D building plans, it has the huge advantage of being a one handed tool that replicates, in part at least, the familiar actions of ‘hand measurement’ viz, rod tape and dimensioned sketch. The big problem with the Disto© is that it doesn’t really automate the measured drawing process.

So simply put the Disto© problem is: ‘how do you get from measurement to drawing?’

We kissed our drawing boards goodbye a long time ago and in doing so started a process of making manual practices fit into CAD workflows. This has been an awkward at best but we can’t ignore the fact that CAD is the most important communication tool for measured graphic information today.

LatimerCAD Ltd has developed DistToPlan http://www.disttoplan.co.uk/ in conjunction with kubit Gmbh to bridge the gap between device and drawing.

Unlike almost any other surveying sensor, the Disto© generates data with no direction or position information. It is quite possible to use the ‘raw’ Disto© data to plot lines in CAD but this involves a great deal of  detailed command line entry to gain positional control of every distance measured. DistToPlan provides the necessary human interface with the drawing by automating as much as possible the geometry alignment procedures that are second nature in drawing board practice. Working with Disto became a lot easier with the advent of the Bluetooth interface which meant the surveyor doesn’t need 3 arms to operate CAD, Disto© and drawing together.

Having evolved over the last 5 years through extensive field trials and comprehensive commercial  testing a 4 method toolset has emerged which adresses the needs of the majority of measured survey practitioners. The final development strategy encompasses the 4 main methods surveyors use to produce plans:

1. Follow the wall – Where a line is plotted by fixed directions (up, down, left, right)  to enclose a perimeter and then brace with diagonals as a check.

2. Triangulation- The plan is determined by the intersects of arcs from a base, each base in turn linked by pairs of arcs.

3. Build up from boxes – Using the simplest plan form and then adapting it to conform to the measurements. ( In the manner of using squared paper to rule up the drawing)

4. Sketch & Measure – A freeform sketch is prepared and then scaled to fit.

DistToPlan will work in any one of these methods by placing the measurements into CAD when cued by the apropriate stage of the chosen method.

Let’s look at a number of common situations where DisToPlan works with the surveyors chosen strategy for measurement and CAD plotting:

Scenario 1: the plan is square and the scale requirement is relaxed (1:100 ‘outline’ survey) and there is a need to build up a building plan quickly.

By using the ‘Rectangular Room’ command the Disto measument is handled as follows, note that the 2 requests for the diagonal  have been ignored with an ‘enter’ stroke:

And the correctly scaled rectangle is placed in CAD. The next room is measured in the same way and placed by using a wall thickness offset:

The room is placed and the alignment point and direction selected:

Once you are happy with the align pint and direction bring the new room into line with the 1st one:

Click to select and the wall offset prompt lets you put in the wall thickness:

So using the rectangle room command we can build up a basic plan very quickly. Now we all know just how rare a rectangualr room plan is! So the next step is to develop the rectangle using the ‘square feature’ tool:
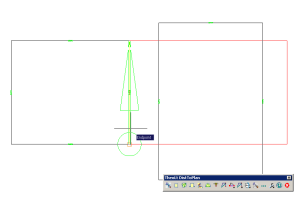
The measurments are sent to the command line at the appropriate prompts and the side of the wall the feature is placed is selected by a pick in the graphics area:

This is the ‘build up from boxes tool’. The room outlines can be aligned in any state but its probabaly best to get the edits for each room done in turn to make the alignments easier. How features are added is shown in Scenario 3 below.

Scenario 2 : The room has a complicated plan and the surveyor wants to be sure of the perimeter shape before measuring, the survey needs ‘free hand’ drawing in AutoCAD.

DistToPlan now has a unique Sketch & Measure tool which will allow a sketch plan to be measured and scaled after drawing. Here’s one way of using it:

Zoom scale to 10x (assuming you are starting from scratch)

This will get your aproximate drawing size close to ‘actual size’.

Select the Sketch & Measure tool and note the custom cursor view: you are now working in an automatically grouped line set with a nominal snap running; the comstraints on placing the line can be adjusted in the sketch panel which pops up on use of the command. The grid and snap weighting are controlled by the pop up panel.

The panel should be kept open throughout preparation of  the sketch as you may need to reset the grid step to get the sketch right. The grid value is reset by a click in the graphics area. Sketch out the plan with the ‘rubber band’ line. The sketch is not just a simple line, DistToPlan stores the lines as a group ready for interrogation by  measurement.

Once you are happy with the sketch the perimeter line is finished with a ‘close’ option from the right click context menu ( or ‘C’ in the command line)  the measure panel will open and measurement can begin. Measurements are added for each line, in any order,  on selection the command line prompts for the distance and also relays the CAD distance  as a rough check.

Missing ties can be added to the plan and measured in with the Add Brace option on the panel. For error distribution DistToPlan needs to have 2 fixed points in the plan and these can be identified at this stage with the Fix Pt option.

The measured lines are anotated with the distances entered at the command line, the  selected line for measurement is highlit with a custom pointer:

The direction of the pointer indicates the end of the line that will be adjusted as well as the direction of the anotation text.
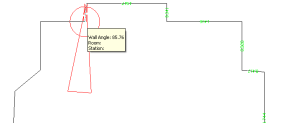
Choosing the  fixed points  (or line): To work, the distributed error maths needs 2 fixed points. For best results the should be located on a long wall opposite the closing point. (At the present release, if fixed points are chosen at the start /close of the loop things can go awry).

On completion of the measure sequence selection of the  finish option on the Measure panel runs an error distribution routine (theofitclosed) and, if the figure is within toloerance, it will be adjusted by least squares to close the perimeter. The shift caused by the adjustment is recorded in the drawing by the plot of the node positions (green and blue by default) before and after adjustmet in apropriate layers.
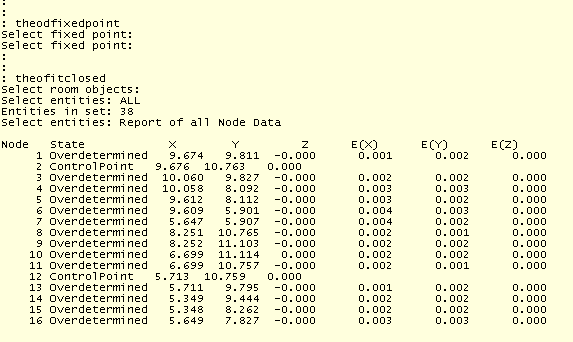
A report is generated and sent to the command line showing the condition of the adjustment.

If needed,  the room can be treated as part of the building plan, at any stage after measurement and the adjustment done at a later time.

Scenario 3 : A FM plan is needed with full anotation of services by use of standardised symbol libraries. To keep track of the operations needed in each room to be measured.

DistToPlan offfers a ‘strategy’ template on the tool pallette. Eash command set needed is prompted by picking off the step on the pallette.

DistToPlan is supplied with a pallette menu which is used to perform 2 key functions.

1.To give acess to the symbol libraries and

2 To control the organisation of the measured data for grouping ( by room, floor plate etc.) so that, if desired, network adjustment by total station can be applied.

The basic plan can be built up using the apropriate measuring tool (e.g the ‘square room’ and align commands used in scenario 1) .

The anotations are added for floor and room height using the prompt from the pallette. Site notes can be added using the add note tool which will attach a reference of a Journal note file or image to the DWG for easy acess to additional information collected by bluetooth camera or site sketches. DistoToPlan will send the new files and prompt to insert them into the project / drawing.

In addition DistToPlan logs the Disto data in a time stamped data file which can be used for either drawing recovery or QA, stores the room geometry for room by room network adjustment if required and supplies a customisable attributed block library for direct DWG insertion.

For full heighting, corner closing and 3D work with a total station TheoLt Building Survey Suite is recomended.

About DistToPlan DistToPlan is available forAutoCAD (full and LT) versions as well as (with some reduced functionality) the AutoCAD alternative BricsCAD from v10 on.

Disto© is a registered trademark of Leica Geosystems Gmbh.

DistoPlan is a registered trademark of LatimerCAD and kubit Gmbh.

TheoLt is a registered trademark of Latimer CAD and English Heritage

AutoCAD is a registered mark of Autodesk Inc.

BricsCAD is a registered mark of Bricsys nv