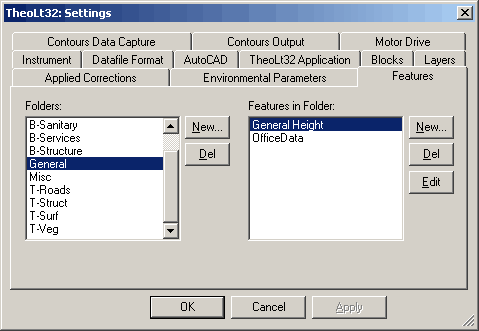
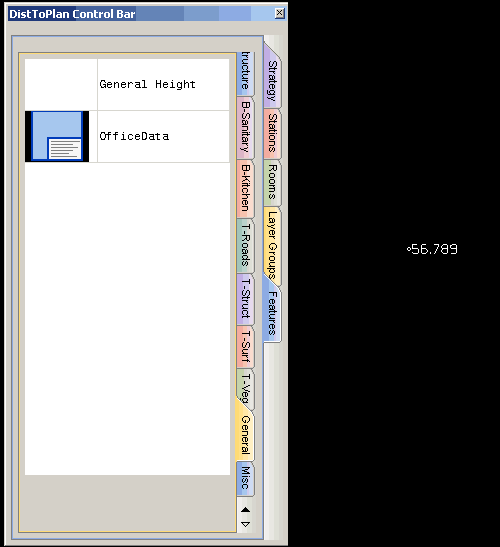
One of the great advantages of TheoLt compared to other survey software is it’s complete flexibility. For example, lets take a look at the “Features Library”.
The basic premise of TheoLt is that it transfers the measurement information or point from a survey instrument (or Distance Meter) to CAD to be used by any command (for example, draw lines, insert blocks etc). What the TheoLt Features Library enables is for a series of measurements to be combined to insert a series of lines, arcs or attributed blocks (much like standard survey “feature coding”).
The feature definitions are accessed through the the settings dialog in the main TheoLt window. Definitions are grouped into folders.
Looking at it’s simplest use, inserting a single attributed block as a detail point. The first stage is to name the feature , define it’s icon and the number of measurements that should be taken to insert the feature. In this case, a single 3D measurement.
The next stage is to define any user attributes that may be required and whether confirmation is required (asking the user to confirm the values). Finally select the block to be inserted.
Once defined, opening the features panel will show the newly created item and a single click on the apropraite icon in the feature palette will prompt for the measurement and the block will be inserted.
Next we can look at a more complex but typical use; kerbs tops and bottom in topographic survey. The aim here is to pick points on the top and the bottom of the kerbs, connecting the points, inserting blocks and annotating levels. This is very typical of topographic survey. Our definition will be point on top of kerb, point on bottom of kerb before moving on to the next part of the kerb.
Defining the feature, we name it and use 2 3D measurements with correct prompts. As we wish to join the points with lines, we will select “repeat insert” and join points on Layer (each point type having it’s own layer). This will allow the lines to be continued for as many measurements as required before exiting the command. The attributes will be the Z-level of the first point only and two blocks will be inserted, each on it’s own layer.
Now when selecting the feature from the palate, the measurements are prompted, blocks are inserted and then the first prompt starts again. After the next round of observations, lines are drawn between the respective points on their designated layers. Options allow the lines to be curved, straight and the alignment of the annotation to be altered or disabled.
The final example is a single complex item; a tree. To measure one fully quite a few measurements are required; the centre of the main trunk, the girth of the trunk, horizontal extent of the canopy and finally the vertical extent (height). These can be defined in the first window with prompts and measurement types. I would assume that for the first measurement the operator would take the angle to the centre of the trunk before taking the distance to the centre. This would leave the instrument pointing to the extent of the girth which we can collect as an angle only measurement. We can also choose to write the details out to a file which can contain any of the collected data fields for processing.
Next we will create the attributes where we will also collect the tree type which will be stored in a list to speed up the user input.
Finally we insert a block to represent the trunk – scaled to match the girth. A second block will be inserted, scaled to math the canopy. An attributed block is inserted to hold the details of the tree (in addition to the file written above).
Obviously, this is not an in-depth analysis of what is possible from the features palate but I hope it gives some indication of the power within TheoLt.


